 Venn diagram is a graphic organizer that can be used to map the logical relationships, including similarities and differences, of multiple subjects. Introduced by British logician John Venn, Venn diagram has been widely used in almost all scientific fields. In general, the diagram consists of at least two circles that may or may not overlap for representing the mapped subjects. In the case where there is no overlapping area created by the circles, the subjects represented by those circles are completely distinct and they don’t share any similarities. In the case where an overlapping area is formed, the overlapping area is a representation of features or characteristics that those different subjects share.
This Venn diagram template is an easy tool for creating a Venn diagram. The template is available with two, three or more circles. Additional circles can be added with ease using Microsoft Word’s shapes function. This Venn diagram template can be used by everyone who are familiar with a word processor.
Do I Need This Template?
Anyone who needs to map the characteristics of multiple subjects and how those subjects compare with one another needs this diagram. You will need this diagram if:
1. You are a student who works on logics, mathematics, etc. and wants to visualize the abstract concepts that are difficult to understand using a lucid graphic organizer that is easier to understand.
2. You are a teacher teaching students about abstract subjects and needs a tool to make your lesson more understandable.
3. You are a researcher who frequently uses graphic organizer to map every aspect of your research.
What Does the Template Contain?
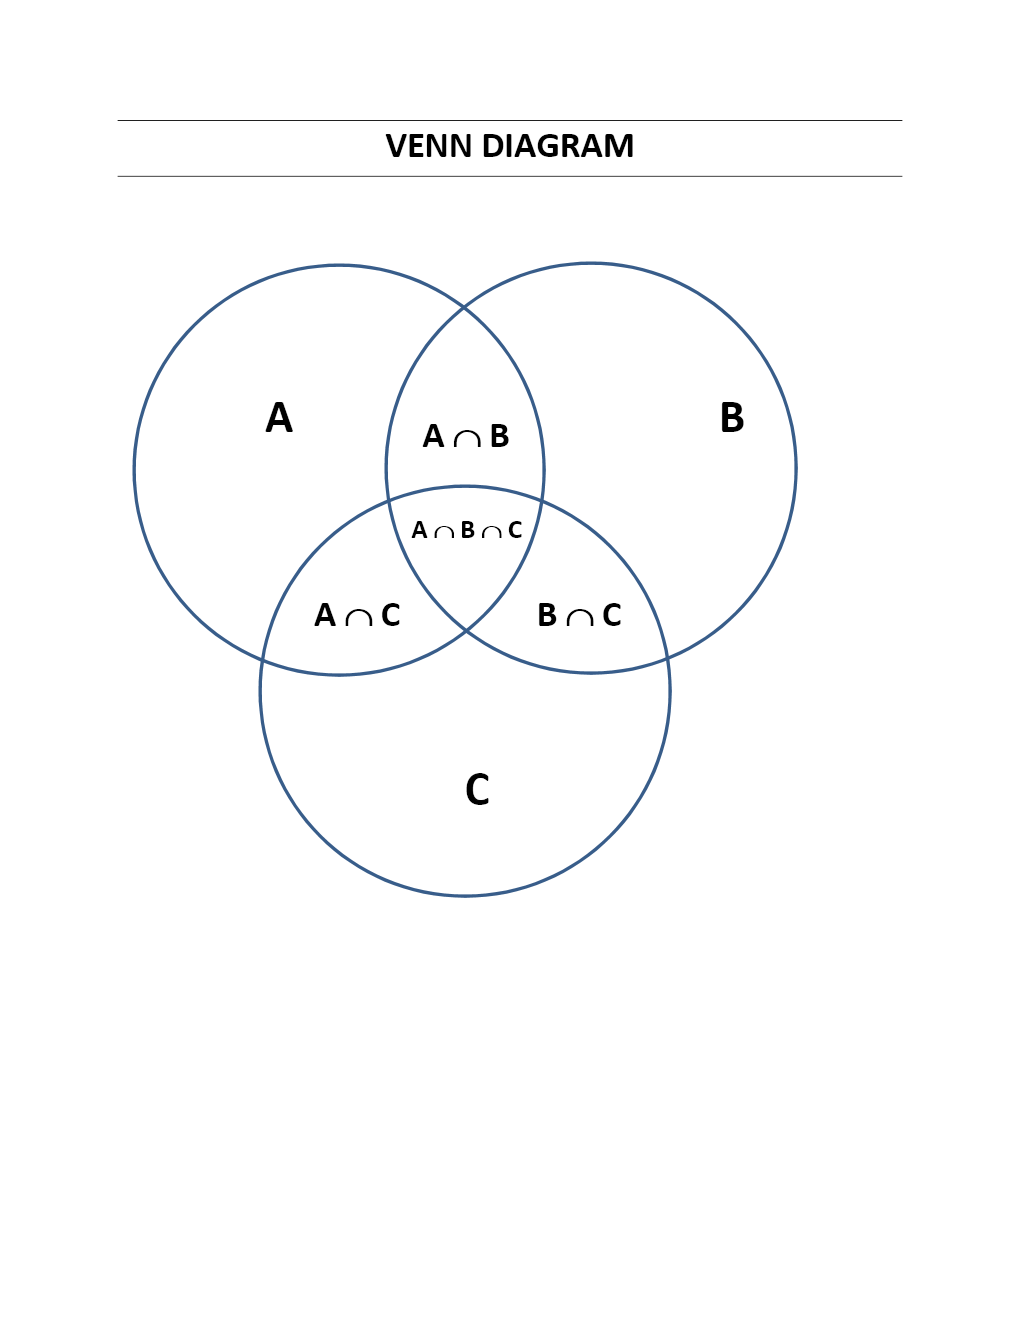
A Venn diagram consists primarily of at least two circles that may or may not overlap one another. For this reason, the template consists of the following elements.
1. Multiple colored circles representing different ideas that may or may not overlap (they have different colors and a certain transparency level so that when they overlap, their colors will also overlap and the overlapping area will have a slightly distinct color.)
2. Editable label for every circle that represents a particular subject
3. Editable label inside each circle and inside overlapping area that represents the distinct and shared characteristics of every subject
A Venn diagram is always a useful tool to see how different subjects relate logically to one another and to develop critical thinking skill. By using this template, the creation of a Venn diagram will be quick and easy.
 Venn Diagram - 3 Circles (26.7 KiB, 1,009 hits)
Venn Diagram - 2 Circles (20.9 KiB, 974 hits)
Other Templates
 Graphic Design Price List
 Issue Log
 Multiple Choice Sheet
 True False Quiz Sheet
 Graph Paper Templates
 Math Quiz Sheet
 Yes No Checklist
 Certificate of Membership
 2016 Calendar Templates
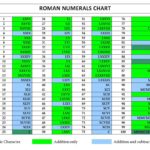 Roman Numerals Chart
 Gantt Chart Template
 Employee of The Month Certificate
 Certificate of Recognition
 2014 Linear Calendar
 Concept Map Template
 Tool Handover Checklist
 Service Request Form
 Call Center Staff Cover Letter
