Fishbone Diagram
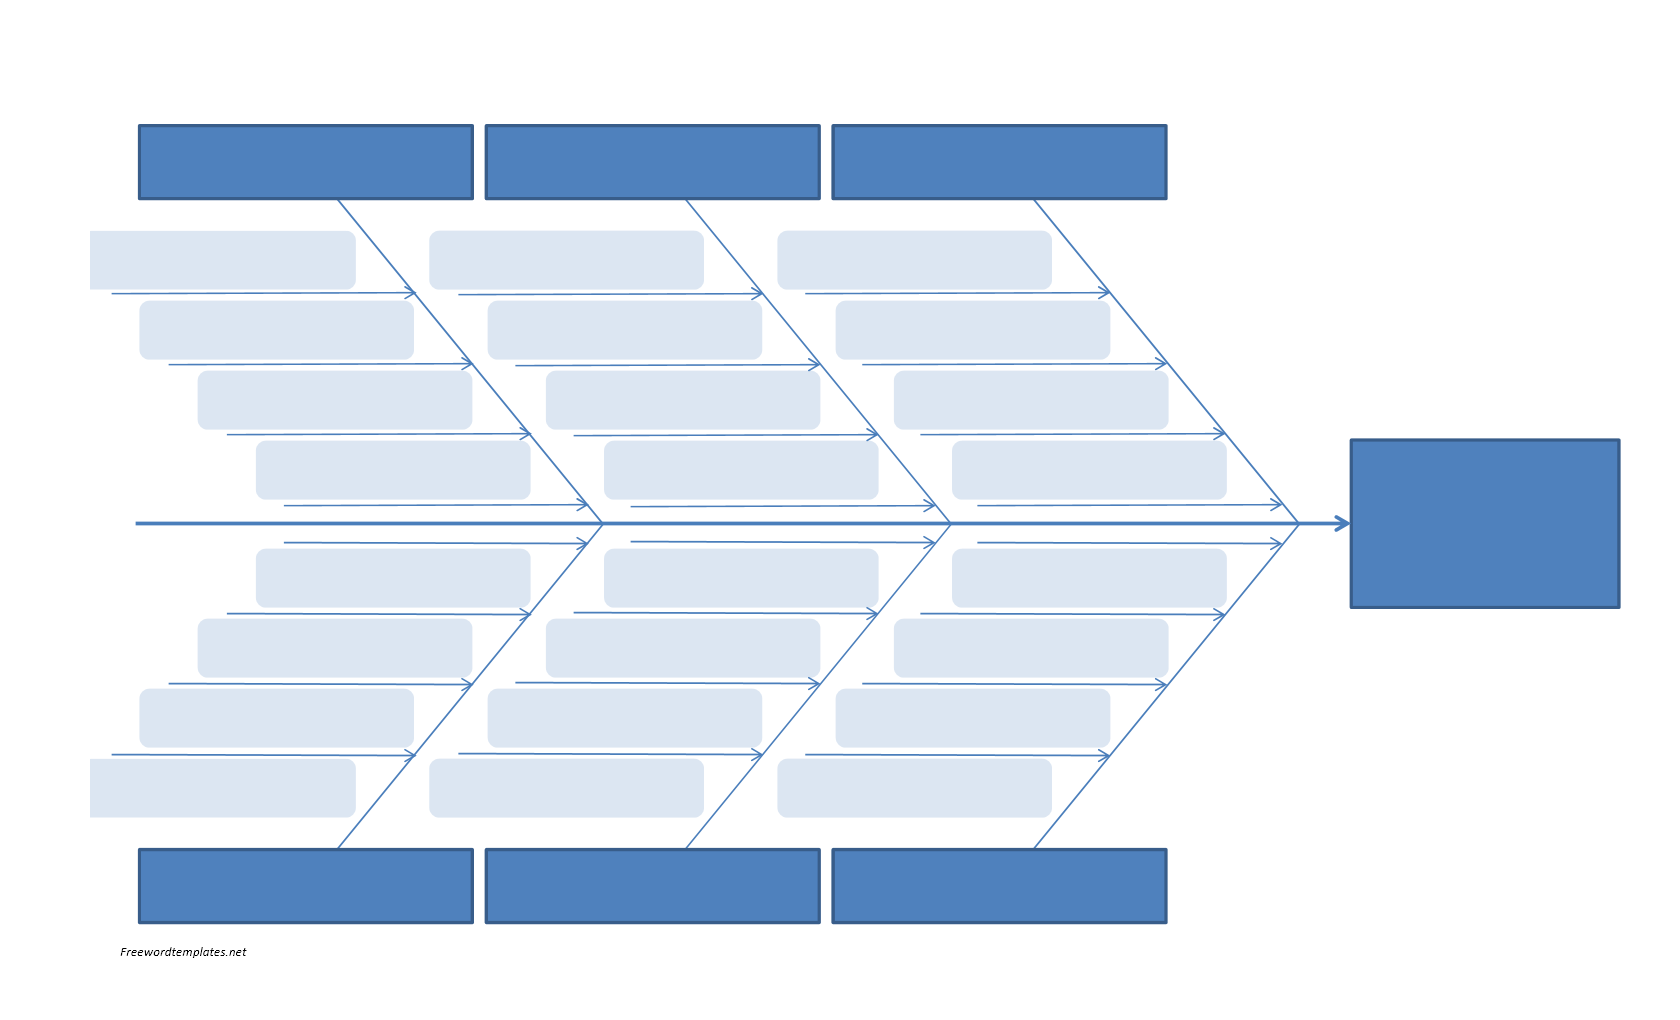
A fishbone diagram, also known as Ishikawa diagram or cause-and-effect diagram, is a diagram introduced by Kaoru Ishikawa to visually represent all factors that have certain influences and effects. The… Read more »
A fishbone diagram, also known as Ishikawa diagram or cause-and-effect diagram, is a diagram introduced by Kaoru Ishikawa to visually represent all factors that have certain influences and effects. The… Read more »
